The Bacterial Microbiome of the Long-Term Aquarium Cultured High-Microbial Abundance Sponge Haliclona cnidata – Sustained Bioactivity Despite Community Shifts Under Detrimental Conditions - Frontiers
Introduction
Sponges (phylum Porifera) occur in marine habitats as significant members of benthic environments (Bell and Smith, 2004; Bell, 2008). As sessile filter-feeders, sponges are permanently exposed to microorganisms from their surrounding aquatic environment, including opportunistic and pathogenic bacteria. However, sponges also host complex, sponge-specific, and evolutionary adapted microbial consortia, which form a functional unit with the host – the sponge holobiont (Rohwer et al., 2002; Rosenberg et al., 2007; Webster and Taylor, 2012; Youle et al., 2013; Bordenstein and Theis, 2015; Webster and Thomas, 2016; Thomas et al., 2016). The sponge microbiome represents a high metabolic diversity and facilitates various, highly efficient nutrient cycles of sponges (Zhang et al., 2019). For example, heterotrophic symbionts have a high impact on the dissolved organic carbon (DOC) uptake and breakdown of carbon. Phototrophic symbionts like Cyanobacteria and zooxanthellae provide further carbon sources to their host and can have beneficial effects on the sponge growth (Erwin and Thacker, 2008; Weisz et al., 2010). Moreover, associated bacteria may most likely protect the holobiont efficiently against invading, potentially pathogenic bacteria via antimicrobial defense (Taylor et al., 2007; Webster and Thomas, 2016).
Based on abundance and diversity of the sponge-associated bacterial assemblages, sponges were divided in two groups (Hentschel et al., 2003, 2006; Gloeckner et al., 2014; Webster and Thomas, 2016): high microbial abundance (HMA) sponges, which harbor abundant and diverse bacterial communities, and low microbial abundance (LMA) sponges, which feature a reduced community diversity and host a low bacterial load similar to the concentrations of the ambient water. Noteworthy, some sponges have been reported that could not be assigned to either group (e.g., Thomas et al., 2016). Distinct microbial community structures were observed for HMA and LMA sponges from the operational taxonomic unit (OTU) and genera to the phylum level (Moitinho-Silva et al., 2017b). A general host specificity of sponge microbiomes at higher taxonomic ranks was more recently studied in detail by Steinert et al. (2017). So far, representatives of more than 60 bacterial phyla, including a large proportion of candidate phyla, were recovered from a broad range of marine sponges (Moitinho-Silva et al., 2017a). This exceptionally high bacterial diversity is unmatched among invertebrate hosts and ranges from dominant to rare taxa (Reveillaud et al., 2014; Thomas et al., 2016).
Sponge-bacteria associations are predominantly stable (Thiel et al., 2007; Pita et al., 2013; Reveillaud et al., 2014), even in long-term cultures of sponges in artificial aquarium systems (Friedrich et al., 2001; Thoms et al., 2003; Gerçe et al., 2009; Bergman et al., 2011). However, it has been previously shown that changing environmental conditions can affect the composition of sponge-associated microbiota (Webster et al., 2010; Fan et al., 2013). Moreover, the stability of the sponge microbiota varies among different host species and may depend on the applied cultivation conditions (Webster and Taylor, 2012). Yet, a large proportion of sponge-associated bacteria remains unclassified from the species up to the phylum level (Moitinho-Silva et al., 2017b). Most of the tightly sponge-associated bacterial taxa represent distinct phylogenetic clusters, which were defined as sponge- (SSC) and sponge-coral-specific (SCS) (e.g., Hentschel et al., 2002; Simister et al., 2012; Taylor et al., 2013). As members of SSCs were also detected in lower abundance in ambient seawater and sediment samples, the term "sponge-enriched specific clusters" was established (Webster and Taylor, 2012; Webster and Thomas, 2016; Thomas et al., 2016). Moitinho-Silva et al. (2014) showed for both, a HMA and a LMA sponge, that typical sponge symbionts had a low transcriptional activity in seawater. This indicated that sponge symbionts are inactive outside the host. The comprehensive global microbiome study of the Porifera performed by Thomas et al. (2016) revealed that the sponge microbiome exhibited little commonality in species composition. Despite the predominance of generalists and specialists among such communities, the specialists were underrepresented in the core symbiont communities. These findings led Thomas et al. (2016) to the conclusion that symbiotic sponge microbiota developed independently within different members of the Porifera, but a convergent force resulted in analogous community organization and interaction. The close interaction of the host and associated bacteria is still not fully understood and several mechanisms may be responsible for the high stability and specificity of such interactions, e.g., the presence of eukaryotic-like proteins coded in the genomes of microbial symbionts (Reynolds and Thomas, 2016). Furthermore, it has been shown that the genomes of bacterial sponge symbionts are enriched with genes associated with bacterial defense, host colonization, and extracellular matrix utilization, as well as nutritional specialization, which can be regarded as a consequence of evolutionary adaptation of symbionts to the host environment (Slaby et al., 2017). Several studies revealed the production of a variety of bioactive compounds by symbionts including those applied for quorum sensing (QS) and antimicrobial defense, which often form the basis for pathogen defense systems (Bewley et al., 1996; Paul and Puglisi, 2004; Hentschel et al., 2006; Taylor et al., 2007; Thomas et al., 2016). The antimicrobial defense was likely one of the key elements in the evolutionary selectivity of sponge-associated microbial communities and thus their resilience against pathogens (Kelman et al., 2001; Rohde et al., 2012). In this context, QS may play an important role in shaping microbial community composition and interactions, and controlling the biological activity of the sponge microbiota. However, the linkage between the functionality of the sponge microbiota and the specificity (dominant vs. rare members), diversity, abundance, and location of symbionts within the sponge matrix remains little studied. Moreover, it is largely unknown whether the sponge contributes to the protection of the associated bacterial consortia.
Here we hypothesized (1) that the long-term aquarium cultured sponge H. cnidata is tightly associated with a typical sponge bacterial microbiota and (2) that the symbiotic Bacteria sustain bioactivity under harmful environmental conditions, facilitating holobiont survival by preventing pathogen invasion. To test these hypotheses, first the bacterial community of the healthy sponge was characterized in terms of abundance, diversity, and location in the sponge matrix. Second, detrimental conditions were simulated via antibiotic exposure and/or light exclusion in a 29 days lasting aquarium experiment to remove transient and non-resilient members of the bacterial microbiota. Finally, the bioactivity (i.e., antimicrobial defense and QS activity) of the affected holobiont was assessed with regard to potential agents among the resilient bacterial community.
Materials and Methods
Sponge and Growth Condition
Experiments were performed with the marine sponge Haliclona cnidata (Schellenberg et al., 2019), which has been in long-term culture at the Justus Liebig University Giessen (Giessen, Germany) since 2000. The model organism has been selected to assess bioactivity-based defense due to clear indication for a pronounced bioactivity (unpublished data). The natural distribution of H. cnidata is unknown (Schellenberg et al., 2019), hence material was sampled from a tropical marine aquarium (4000 L closed water circulating tank system, a constant water temperature of 26°C, 10:14 light:dark photoperiod, salinity of 32–33%). Water currents were created using a wavebox (10,000 L/h; Tunze, Penzberg, Germany) with a water flow through of 2000 L/h. Water parameters are given as Supplementary Table S1.
Microscopical Observation of the Sponge Microbiota
Sponge-associated bacterial communities were first determined microscopically from fixed and partially maturated sponge fragments using different microscopical techniques including SybrGreen I (SG-I) based cell staining, catalyzed reporter deposition fluorescence in-situ hybridization (CARD-FISH) with a mixture of universal Bacteria 16S rRNA probes, and by transmission electron microscopy (TEM) analysis. Details of the analyses are described as Supplementary Material and Methods.
Setup of Resilient Community Generating Experiment
To reduce the associated microbiota to a resilient community, sponge specimens were exposed to antibiotics (ampicillin, gentamicin) to remove most of the host-associated bacterial symbionts and dark incubated to reduce the phototrophic symbionts. Four treatments were performed over 29 days: control (LN), exposure to antibiotics (LA), dark incubation (DN), and dark incubation combined with antibiotic exposure (DA) (Supplementary Figure S1). Antibiotic treatments contained two antibiotics to affect Gram-positive and Gram-negative bacteria, the ß-lactam antibiotic ampicillin (ampicillin sodium salt >99%) and the aminoglycoside antibiotic gentamicin (gentamycin sulfate >590 I.E. mg−1) in a concentration of 100 mg L−1 each (both Carl Roth, Karlsruhe, Germany) (according to Friedrich et al., 2001). Three non-connected 12-liter tanks containing three sponge fragments each (independent biological replicates) were used per treatment (Supplementary Figure S1). Each tank was equipped with a submersible 10 W heater (NWO-10P, Aquarium Systems, Sarrebourg, France), and an air stone for water movement and oxygenation. Water parameters were monitored regularly (Supplementary Table S1). The water temperature was set to 26°C. For acclimation, sponge fragments were placed in the tanks 14 days prior to the start of the experiment with the tanks connected to the closed-circulating water system. For the experiment, all tanks were disconnected from the closed-circulating water system to prevent the distribution of antibiotics. Water movement and oxygenation were maintained via air stones and fresh water supply was assured through manual water exchange (8 L day−1) including a replacement of the antibiotics, respectively. Sponges were sampled right before the start of the experiment (t0, sponge 2012), after 17 (t17), and after 29 days (t29) of the experiment. Samples of 1–2 cm were cut with a sterile razor blade from the growing tip of the individual sponge fragments. Cut sponge fragments were dipped off gently on sterile paper and stored directly at −20°C for subsequent bacterial abundance and community composition, or bioactivity analyses. Further details are provided as Supplementary Information.
Extraction of Total Community DNA From Sponge Fragments
Sponge fragments (∼100 mg per sponge individual) were washed with autoclaved and 0.2 μm-filtered ambient water (AW) obtained from the studied marine aquaria system and stored at −20°C. In 2015, water-associated bacteria were collected before sponge sampling from 1 L surrounding aquarium water of three locations of the tank on 0.22 μm SterivexTM-GP filter units (Merck Millipore, Burlington, United States). Remaining water was fully removed from the cartridges and filter units were frozen in liquid nitrogen. Frozen plastic cartridges of the filter units were broken by mechanical treatment and filters subjected to DNA extraction. Total DNA was extracted from sponge samples and filters using the Gen Elute Plant Genomic DNA Kit (Sigma-Aldrich, St. Louis, United States). All samples were homogenized by bead-beating with 1 g of silica beads in the lysis solution of the kit using a Retsch mill (MM2; Retsch GmbH, Haan, Germany) for 1 min at maximum speed. Subsequent DNA extraction was performed according to the manufacturer's protocol using two elution steps with 100 μL elution solution each and stored at −20°C.
Quantification of the Bacterial Load in Sponge Fragments
The concentration of sponge-associated Bacteria was assessed by quantitative real-time PCR (qPCR). Subsequently, the number of bacterial 16S rRNA gene targets was set in relation to the number of mitochondrial cytochrome oxidase I (COI) gene targets of the sponge. Analysis was performed in a CFX96 Touch cycler (Bio-Rad, Munich, Germany) using the SsoFastTM EvaGreen Supermix (Bio-Rad). All qPCRs were performed in a total volume of 10 μL including 1x Sso Fast EVA Green reaction mixture, primer system specific primer concentrations, and 1 μL template DNA. Bacterial 16S rRNA gene targets were amplified with 0.2 μM (each) of primers Universal-F (5′-GTGSTGCAYGGYTGTCGTCA-3′) and Universal-R (5′-CCCCTCKGSAAAGCCTTCTTC-3′) (Maeda et al., 2003). PCR conditions were: 98°C for 2 min, followed by 35 cycles of 98°C for 20 s, 60°C for 20 s, and 72°C for 20 s. QPCR analysis of the COI gene was performed with 0.5 μM (each) of primers LCO1490 (5′-GGTCAACAAATCATAAAGATATTGG-3′) and HCO2198 (5′-TAAACTTCAGGGTGACCAAAAAATCA-3′) (Folmer et al., 1994). PCR conditions were: 98°C for 2 min, 37 cycles of 94°C for 40 s, 42°C for 40 s, and 72°C for 60 s. Plate reads during qPCRs were taken at the end of each cycle. Melting curve analyses by subsequent heating from 65 to 95°C with an increase of 0.5°C each 5 s confirmed the amplification of specific targets. The size of the PCR products was checked by 1.7% (w/v) agarose gel electrophoresis performed in 1x TBE buffer using the 100 bp DNA ladder plus (Thermo Fischer Scientific) to determine the product size. A serial dilution of known target numbers of 16S rRNA gene fragments amplified from genomic DNA of Citrobacter freundii ATCC 8090T was used to generate a standard curve and to calculate the efficiency of the qPCR. Bacterial 16S rRNA gene fragments for qPCR standards were amplified in a total volume of 100 μL with 1 μL template DNA and the primers 8F (5′-AGAGTTTGATCCTGCTCAG-3′; Edwards et al., 1989) and 1492R (5'-GGTTACCTTGTTACGACTT-3′; Stackebrandt and Liesack, 1993) using standard conditions (Schauss et al., 2015). PCR products were purified using the QIAquick PCR Purification Kit (Qiagen, Hilden, Germany) and DNA quantity was measured with a NanoDropTM 2000 spectrophotometer (Thermo Fisher Scientific, Waltham, United States). The concentration of 16S rRNA gene copies was calculated according to Kolb et al. (2003). Samples and corresponding standards were run in technical duplicates. Gene copy numbers and qPCR efficiency were calculated using the Bio-Rad CFX Manager software (version 3.0). Efficiencies of qPCRs were 102.7% (R2 = 0.969) for primer system Universal-F/Universal-R and 111.8% (R2 = 0.990) for LCO1490/HCO2198, respectively. Relative changes of bacterial gene copy numbers were calculated according to the 2−ΔΔCT method (Livak and Schmittgen, 2001). The COI gene of the sponge was used as an internal control. Standard deviations were calculated by the standard propagation of error method. QPCR data were subjected to Kruskal-Wallis One Way Analysis of Variance (ANOVA) on Ranks and a post hoc Tukey test in SigmaPlot (version 12.0, Systat Software Inc., San Jose, CA, United States).
Bacterial Community Fingerprinting Using PCR DGGE
Sponge- and water-associated bacterial communities were analyzed including independent biological replicates by denaturing gradient gel electrophoresis (DGGE) based bacterial community fingerprinting. Specifically, the sponge microbiota was assessed in 2012 ("Sponge 2012") and 2015 ("Sponge 2015"). Universal bacterial 16S rRNA gene targeting primers GC339F and 907R (Muyzer et al., 1993) were used for PCR amplification of 16S rRNA gene fragments from the total DNA extracts of individual sponge fragments and water samples according to Glaeser et al. (2010). PCRs were performed in a total volume of 50 μL including 1x DreamTaq buffer, 0.1 μM of each dNTPs, 0.4 μM of each primer, 0.4 mg mL−1 BSA, 0.02 U μL−1 DreamTaq DNA polymerase (all chemicals from Thermo Fisher Scientific, formerly Fermentas), and 1 μL undiluted DNA extract. PCR cycling conditions were: 95°C for 3 min, followed by 32 cycles of 95°C for 30 s, 55°C for 30 s, and 72°C for 40 s, and finally 72°C for 30 min. DGGE analysis was performed as described in detail by Glaeser et al. (2010, 2014) using an Ingeny PhorU system model IPU-S (Ingeny International BV, GP Goes, the Netherlands) and ethidium bromide staining of DGGE gels. DGGE based community fingerprint patterns were analyzed in GelCompar II (version 4.5, Applied Maths, Sint Martens Latem, Belgium) after image pre-processing in Photoshop CS6.0 (Adobe, San Jose, United States). Presence, absence, and relative abundance of DNA bands were accounted using the Pearson similarity coefficient to generate similarity matrices. The band matching tool in GelCompar II was applied to export relative abundance values of DNA band patterns for statistical analysis in PAST (version 3.11). Relative abundance patterns of DNA bands (based on DNA band intensities) were used for community comparison using PAST, respectively. Non-metric multidimensional scaling (NMDS) ordination analyses and hierarchical clustering were performed based on distance matrices generated with the Bray-Curtis dissimilarity coefficient. Bacterial profiles of the sponge and water communities were tested for significant differences by two-sample Kolmogorov-Smirnov tests in R Studio version 1.2.1335 (R Studio Team 2018). Differences among the bacterial community profiles of the resilient community experiment (including three biological replicates per sample) were tested for significance by one-way nested analysis of similarity (ANOSIM; strata = time) applying Bray-Curtis distances calculations in R (version 3.2.0 statistical environment; R Studio Team 2018) with the "Vegan" R package version 2.3-1 (Oksanen et al., 2015).
For identification, DGGE bands were either directly sequenced or cloned before sequence analysis. Briefly, cloning was performed by re-amplification of excised DNA bands with primers 339F and 907R using the CloneJET PCR cloning kit (Thermo Fisher Scientific) according to manufacturer's protocol and competent DH5α cells (Bioline, London, United Kingdom) for transformation. After verifying the melting behavior of re-amplified cloned DNA fragments by DGGE in comparison to the environmental samples, cloned DNA fragments were re-amplified from E. coli clones using primers pJET1.2F and pJET1.2R (Thermo Fisher Scientific, formerly Fermentas) and sequenced with the Sanger technology by LGC genomics using one of the pJET vector primers. DGGE band derived sequences are available under GenBank/EMBL/DDBJ accession numbers MH045531 – MH045540.
Bacterial Community Analysis by 16S rRNA Gene Amplicon Illumina MiSeq Sequencing
Pooled replicates of sponge and water DNA extracts were analyzed by paired-end 16S rRNA gene amplicon high-throughput sequencing using an Illumina MiSeq V3 system. 16S rRNA gene fragments were PCR amplified with primers 341F and 785R (cited as S-D-Bact-0341-b-S-17/S-D-Bact-0785-a-A-21 by Klindworth et al., 2013) and 300 bp paired-end read sequencing was performed by LGC Genomics (Berlin, Germany). The Illumina bcl2fastq 1.8.4 software was used for demultiplexing of all libraries and reads were sorted by amplicon inline barcodes (allowing one barcode mismatch; discarding reads with missing, one-sided, or conflicting barcodes). After clipping sequence adaptors, reads with a length <100 bp were discarded and primers (allowing 3 mismatches) were used for sequence orientation. Forward and reverse reads were combined using BBMerge (version 34.48). The combined read pair data set was used for further analysis. FASTQC files were converted to fasta files using the fastq.info program as implemented on the Galaxy platform and fasta files were submitted to the NGS analysis pipeline of the SILVA rRNA gene database project (SILVAngs 1.3) (Quast et al., 2013). The SILVA Incremental Aligner [SINA v1.2.10 for ARB SVN (revision 21008)] (Pruesse et al., 2012) was used for read alignment against the SILVA SSU rRNA SEED and quality controlled (Quast et al., 2013). Subsequent processing omitted reads that were shorter than 50 aligned nucleotides or showed either more than 2% of ambiguities, 2% of homopolymers, or putative contaminations and artifacts that were seen as reads with a low alignment quality (50 alignment identity, 40 alignment score reported by SINA), respectively. Quality control continued with dereplication and clustering of unique reads as OTUs on a per sample basis using cd-hit-est (version 3.1.2) (Li and Godzik, 2006). The tool was run in accurate mode, ignoring overhangs and applying identity criteria of 1.00 and 0.98, respectively. Classification of the reference read of each OTU was performed with blastn (version 2.2.28+) with standard settings (Camacho et al., 2009) against the non-redundant version of the SILVA SSU Ref dataset (release 128). Each classified OTU reference read was mapped onto all reads that were assigned to the respective OTU to yield information about the number of individual reads per taxonomic path within the limitations of both multiple rRNA operons and PCR and sequencing technique biases. Reads remained unclassified and were assigned to the meta group "no relative" if they lacked BLAST hits or showed weak BLAST hits [defined as a minimum of 93 for function (% sequence identity + % alignment coverage)/2]. This method was established by Klindworth et al. (2013) and Ionescu et al. (2012). Raw data of paired-end sequence read are available at the Sequence Read Archive (SRA) under BioSample accessions number SAMN08957770-SAMN08957776 within the BioProject PRJNA451083.
Sequences assigned as Archaea, chloroplast, mitochondria, or "no relative" were omitted from the analysis (1.3 and 0.3% of the total sequences obtained for sponge 2012 and 2015 and 7.4% for the water sample; Supplementary Table S2). Bacterial communities were compared at the level of relative abundances of bacterial phyla and phylogenetic groups (i.e., taxonomic paths to the lowest taxonomic rank not exceeding the genus rank). Diversity indices were calculated based on the absolute sequences assigned to phylogenetic groups using PAST (version 3.11). Principal component analysis (PCA) and SIMPER analysis was performed to determine phyla or individual phylogenetic groups that contributed most to the community dissimilarity between samples. Venn diagrams showing presence and absence of phylogenetic groups were generated using the online tool of Bioinformatics and Evolutionary Genomics.
Bioactivity Screening
Bioactivity of holobiont-derived compounds was analyzed for individual sponge fragments of the four different experimental treatments at t29 by high-performance thin-layer chromatography (HPTLC) coupled to a bioluminescence assay according to Klöppel et al. (2008). In this assay, extracts are coated with a bioluminescent bacterial strain (Aliivibrio fischeri) and bioactivity of the separated compounds inhibit or enhance the bacterial luminescence on the plate, which facilitates detection of antimicrobial compounds and QS signals. Briefly, 1 cm of sponge fragments (of one individual colony per treatment) were frozen for 24 h at −20°C and subsequently lyophilized and grounded with a mortar and pestle. Bioactive compounds were extracted in methanol (2 mL per 20 mg sponge fragment) on a magnetic stirrer (250 min−1) for 24 h in a cooling chamber at 4 °C. Samples were centrifuged at 6,000 × g for 4 min to remove tissue and cell remnants and 14 μL of the crude extract was applied to a HPTLC silica gel 60 F254 plate (Merck, Darmstadt, Germany) as 4 mm bands using the Automatic TLC Sampler 4 (ATS 4; CAMAG, Muttenz, Switzerland) and dried in a stream of warm air for 1 min. The plates was developed in an Automated Multiple Developing System 2 (AMD2; CAMAG) with a fifteen-step gradient based on methanol, dichloromethane, and n-hexane. The plate was dipped automatically by the TLC Chromatogram Immersion Device (CAMAG) into a Aliivibrio fischeri DSM 7151 suspension. Thereafter, the plate was kept moist and covered with a glass plate to prevent dehydration. Enhancement and inhibition of bioluminescence appeared as brightened and darkened zones, respectively, by the bioluminescence measurement (Klöppel et al., 2008). Changes in the bioluminescence signal were documented every second minute over 38 min by the BioLuminizer (CAMAG). Patterns of bioactivity were analyzed in GelCompar II after image pre-processing in Photoshop CS6.0. Bioactivity zone areas were accounted by the application of the Pearson similarity coefficient to generate similarity matrices for Unweighted Pair Group Method with Arithmetic Mean (UPGMA) cluster analysis.
Results
Haliclona cnidata Hosts a HMA-Typical Sponge-Specific Bacterial Consortium in Bacteriocytes
The bacterial consortium associated with H. cnidata was first characterized with respect to the bacterial load of the long-term cultured sponge. Counting of SG-I stained bacterial cells in maturated sponge fragments resulted in a mean concentration of 4.1 (± 1.9) × 1010 bacterial cells per g sponge wet weight (mean of three independent replicates). Epifluorescence microscopy of SG-I (Figure 1A) and CARD-FISH (Figures 1B,C) stained sponge-associated bacterial assemblages showed aggregates of morphologically diverse bacterial cells. Among those, large rod-shaped, morphologically identical autofluorescent cells occurred, indicating a high abundance of phototrophic bacteria. High amounts of filamentous cells were visualized in aggregates after SG-I staining, but went undetected in CARD-FISH analysis with the universal Bacteria 16S rRNA targeting probes. Transmission electron microscopy showed a low number of free bacterial cells in the extracellular sponge matrix (mesohyl) (Figure 2A), while morphologically diverse bacterial consortia were localized in interconnected vacuole-like structures of amoeboid host cells (Figure 2B). Those bacteria-containing sponge cells were previously reported as bacteriocytes (Vacelet and Donadey, 1977). In H. cnidata, bacteriocytes were found evenly distributed within the mesohyl. Coccoid cells with ring-like structures indicated the presence of thylakoid membrane containing phototrophic bacteria, most likely Cyanobacteria, within the vacuoles of bacteriocytes (Figure 2B) and narrow cells cut in length in bacteriocytes (Figure 2B) may represent the filamentous cells shown by SG-I staining (Figure 1A).
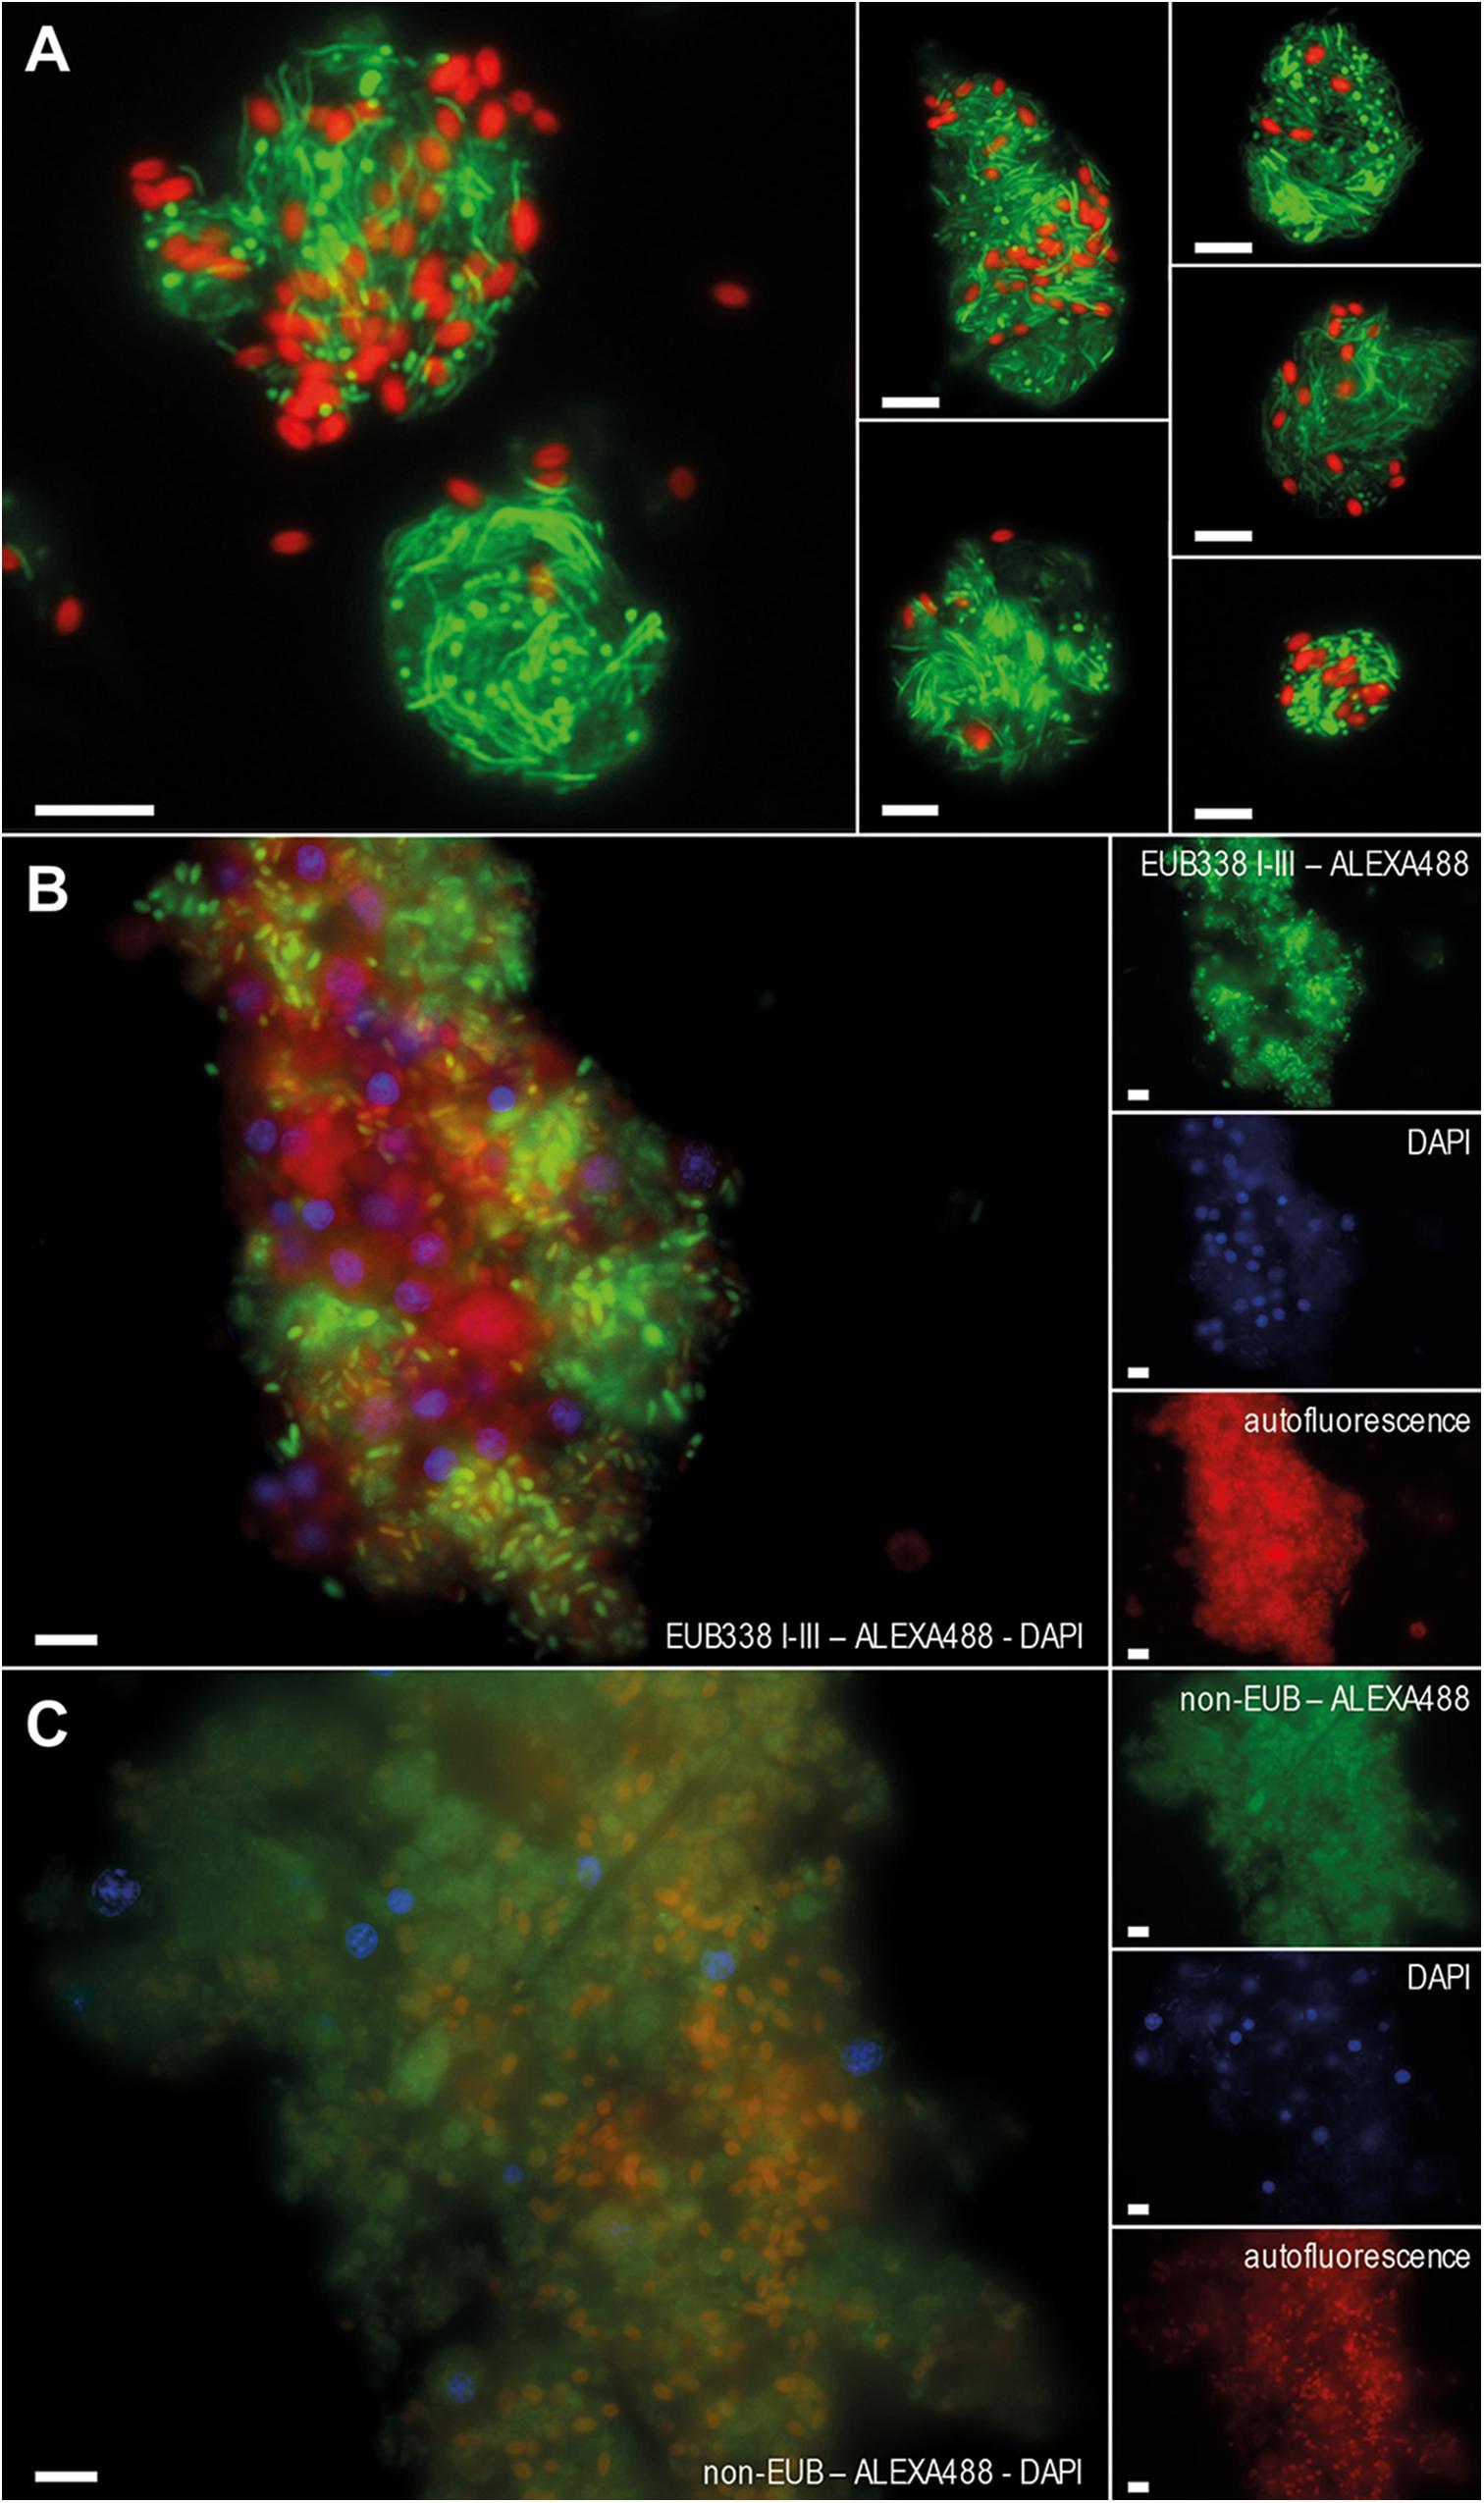
Figure 1. Epifluorescence microscopy of bacterial assemblages derived from maturated sponge fragments of the studied Haliclona cnidata. Composite images of SybrGreen-I (SG-I) and CARD-FISH stained sponge-associated bacterial assemblages present in maturated sponge tissue, green: SG-I or probe signal; red: autofluorescence. SG-I stained bacterial cells of washed and maturated sponge fragments diluted to 10−2 for quantification (A). Single and composite CARD-FISH images after hybridization with the universal Bacteria probe EUB338 I-III mix (B) or a non-binding probe non-EUB (C) conjugated with Alexa Fluor488. DAPI (blue) was used for counterstaining. Other colors refer to autofluorescence. Auto-fluorescence cells (red) indicate the presence of phototrophs. Those cells had a mean size of 1.8 (± 0.6) μm × 1.0 (± 0.3) μm (length x width) and were larger than the majority of the visualized green-fluorescent (heterotrophic) bacterial cells, which had a mean size of 1.5 (± 0.5) μm × 0.5 (± 0.2) μm. Scale bars 5 μm each.
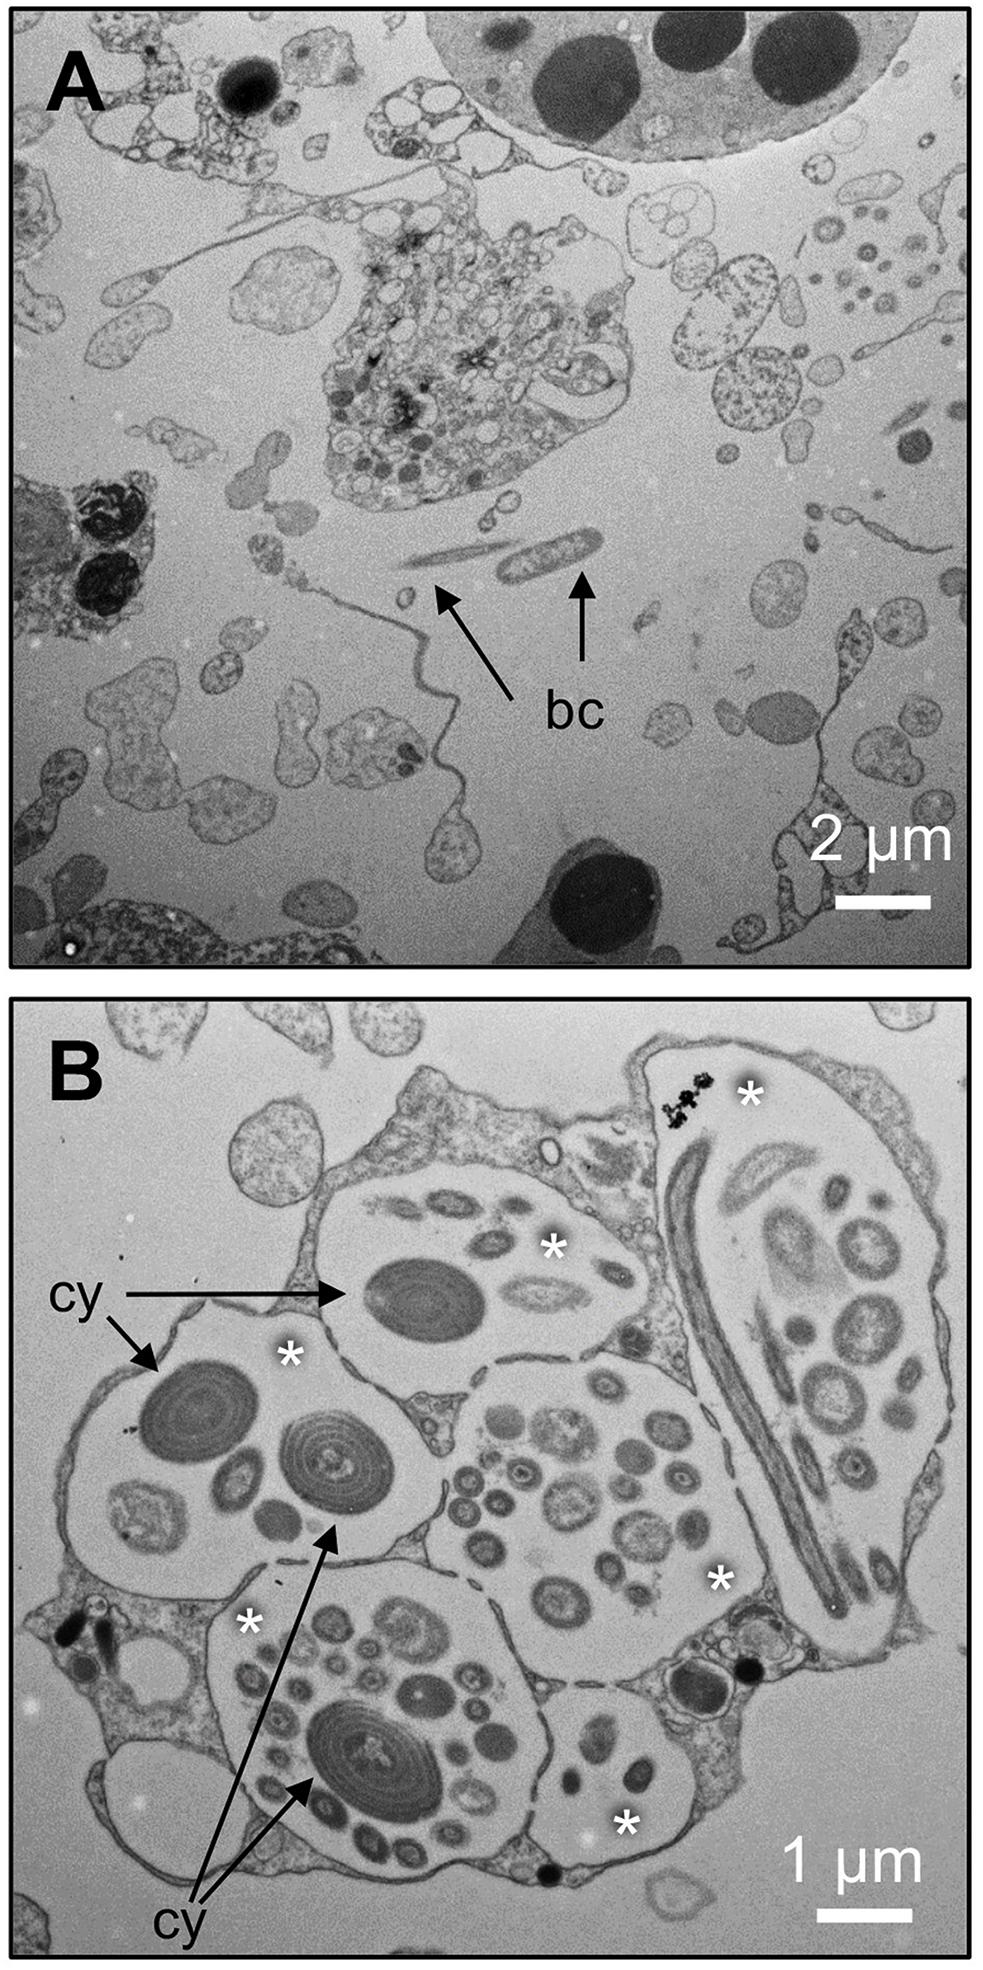
Figure 2. Localization of bacteria in the studied Haliclona cnidata. Transmission electron microscopy (TEM) images of sponge fragments revealed a low number of free bacterial cells in the mesohyl of the sponge (A, scale bar 2 μm) but abundant interconnected vacuole-like structures (indicated by asterisks) of amoeboid host cells (bacteriocytes) comprising morphologically diverse bacterial cells (B, scale bar 1 μm). bc, bacterial cells; cy, potentially spiral thylakoid membranes of a coccoid cyanobacterium.
The stability, diversity, and phylogenetic composition of the sponge-associated microbiota were further characterized by 16S rRNA gene sequence-based approaches. At least three individual sponge fragments were collected in 2012 and 2015 from different parts of the same aquarium system. In 2015, the bacterial assemblage of the surrounding water was studied in parallel. Bacterial community fingerprinting by 16S rRNA gene-based PCR-DGGE analysis showed three characteristics of the sponge-associated bacterial microbiota (Figures 3A,B). First, sponge fragments sampled from different locations in the aquaria system at the same time (both in 2012 and 2015) had identical DGGE fingerprint patterns, indicating the presence of a stable, abundant bacterial community associated with the sponge. Second, the comparison of DGGE patterns obtained from 2012 and 2015 collected sponge fragments revealed no significant differences (Kolmogorov-Smirnov test, Bonferroni corrected p-value; p > 0.05; Supplementary Table S3), indicating the presence of a temporally stable microbiota of the sponge in the marine aquarium system (Figure 3). Minor dissimilarities between the samples were caused by different intensities of a few abundant DNA bands (representing the most abundant bacterial community members). Third, the sponge-associated bacterial assemblages were significantly different (Kolmogorov–Smirnov test, Bonferroni corrected p-value; p < 0.05; Supplementary Table S3) from the bacterial assemblages present in the surrounding water (only shown for 2015; Figures 3A,B). The sponge and water-associated bacterial community patterns differed regarding the presence of abundant DNA bands and the total number of DNA bands. Sponge samples were characterized by a larger number of highly abundant DNA bands, while water samples featured many faint DNA bands indicated by the smear in the DGGE gel (Figure 3B). Neither the sponge nor the water-associated bacterial assemblages showed a high variability among replicates (Figures 3A,B). For the DGGE patterns of sponge samples, most abundant DNA bands represented typical sponge symbionts as indicated by high 16S rRNA gene sequence similarities to cloned 16S rRNA gene fragments of marine sponges including Proteobacteria next related to the genera Roseovarius, Thioprofundimonas, Lutimaribacter, and Thalassobaculum, Bacteroidetes next related to Ownenweeksia and Rhodothermus, and an Acidobacterium next related to Paludibaculum as well as Cyanobacteria next related to Prochlorococcus species (Figure 3B and Table 1).
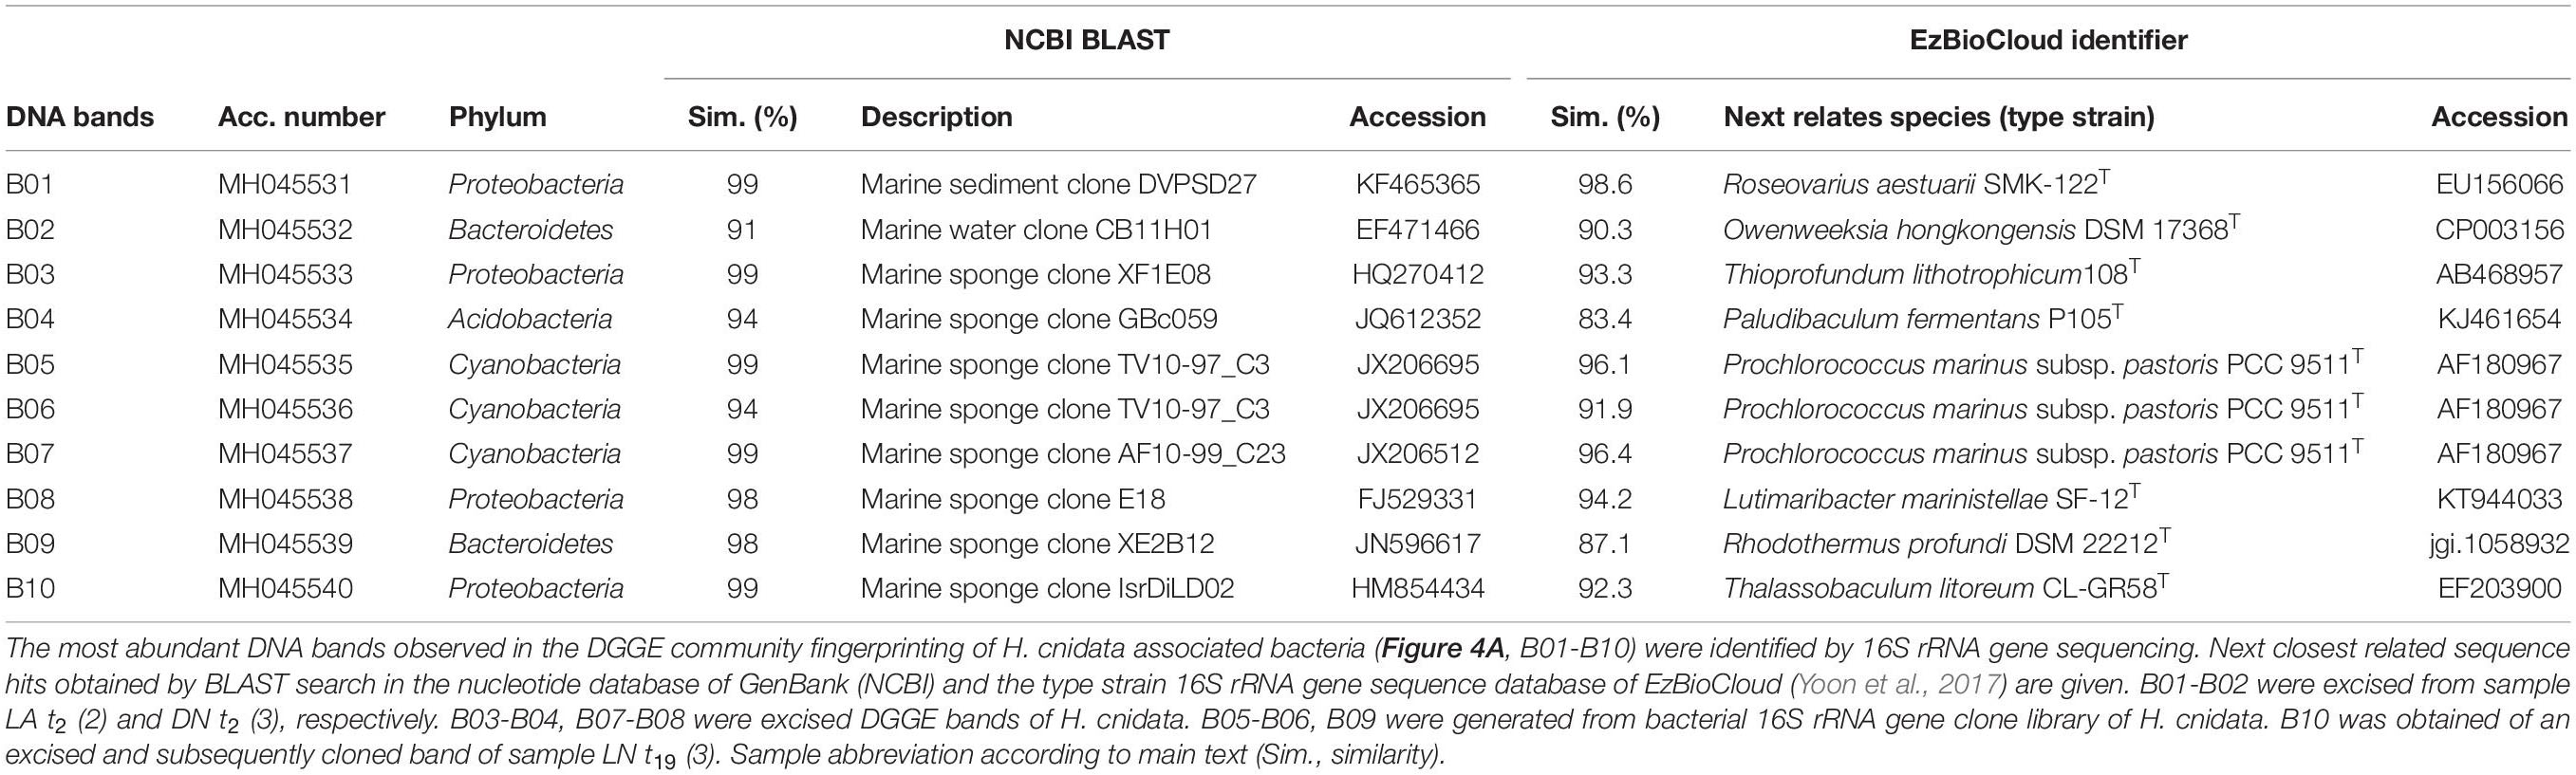
Table 1. Phylogenetic assignment of DNA bands from DGGE based community fingerprinting of the bacterial microbiota of the studied sponge Haliclona cnidata.
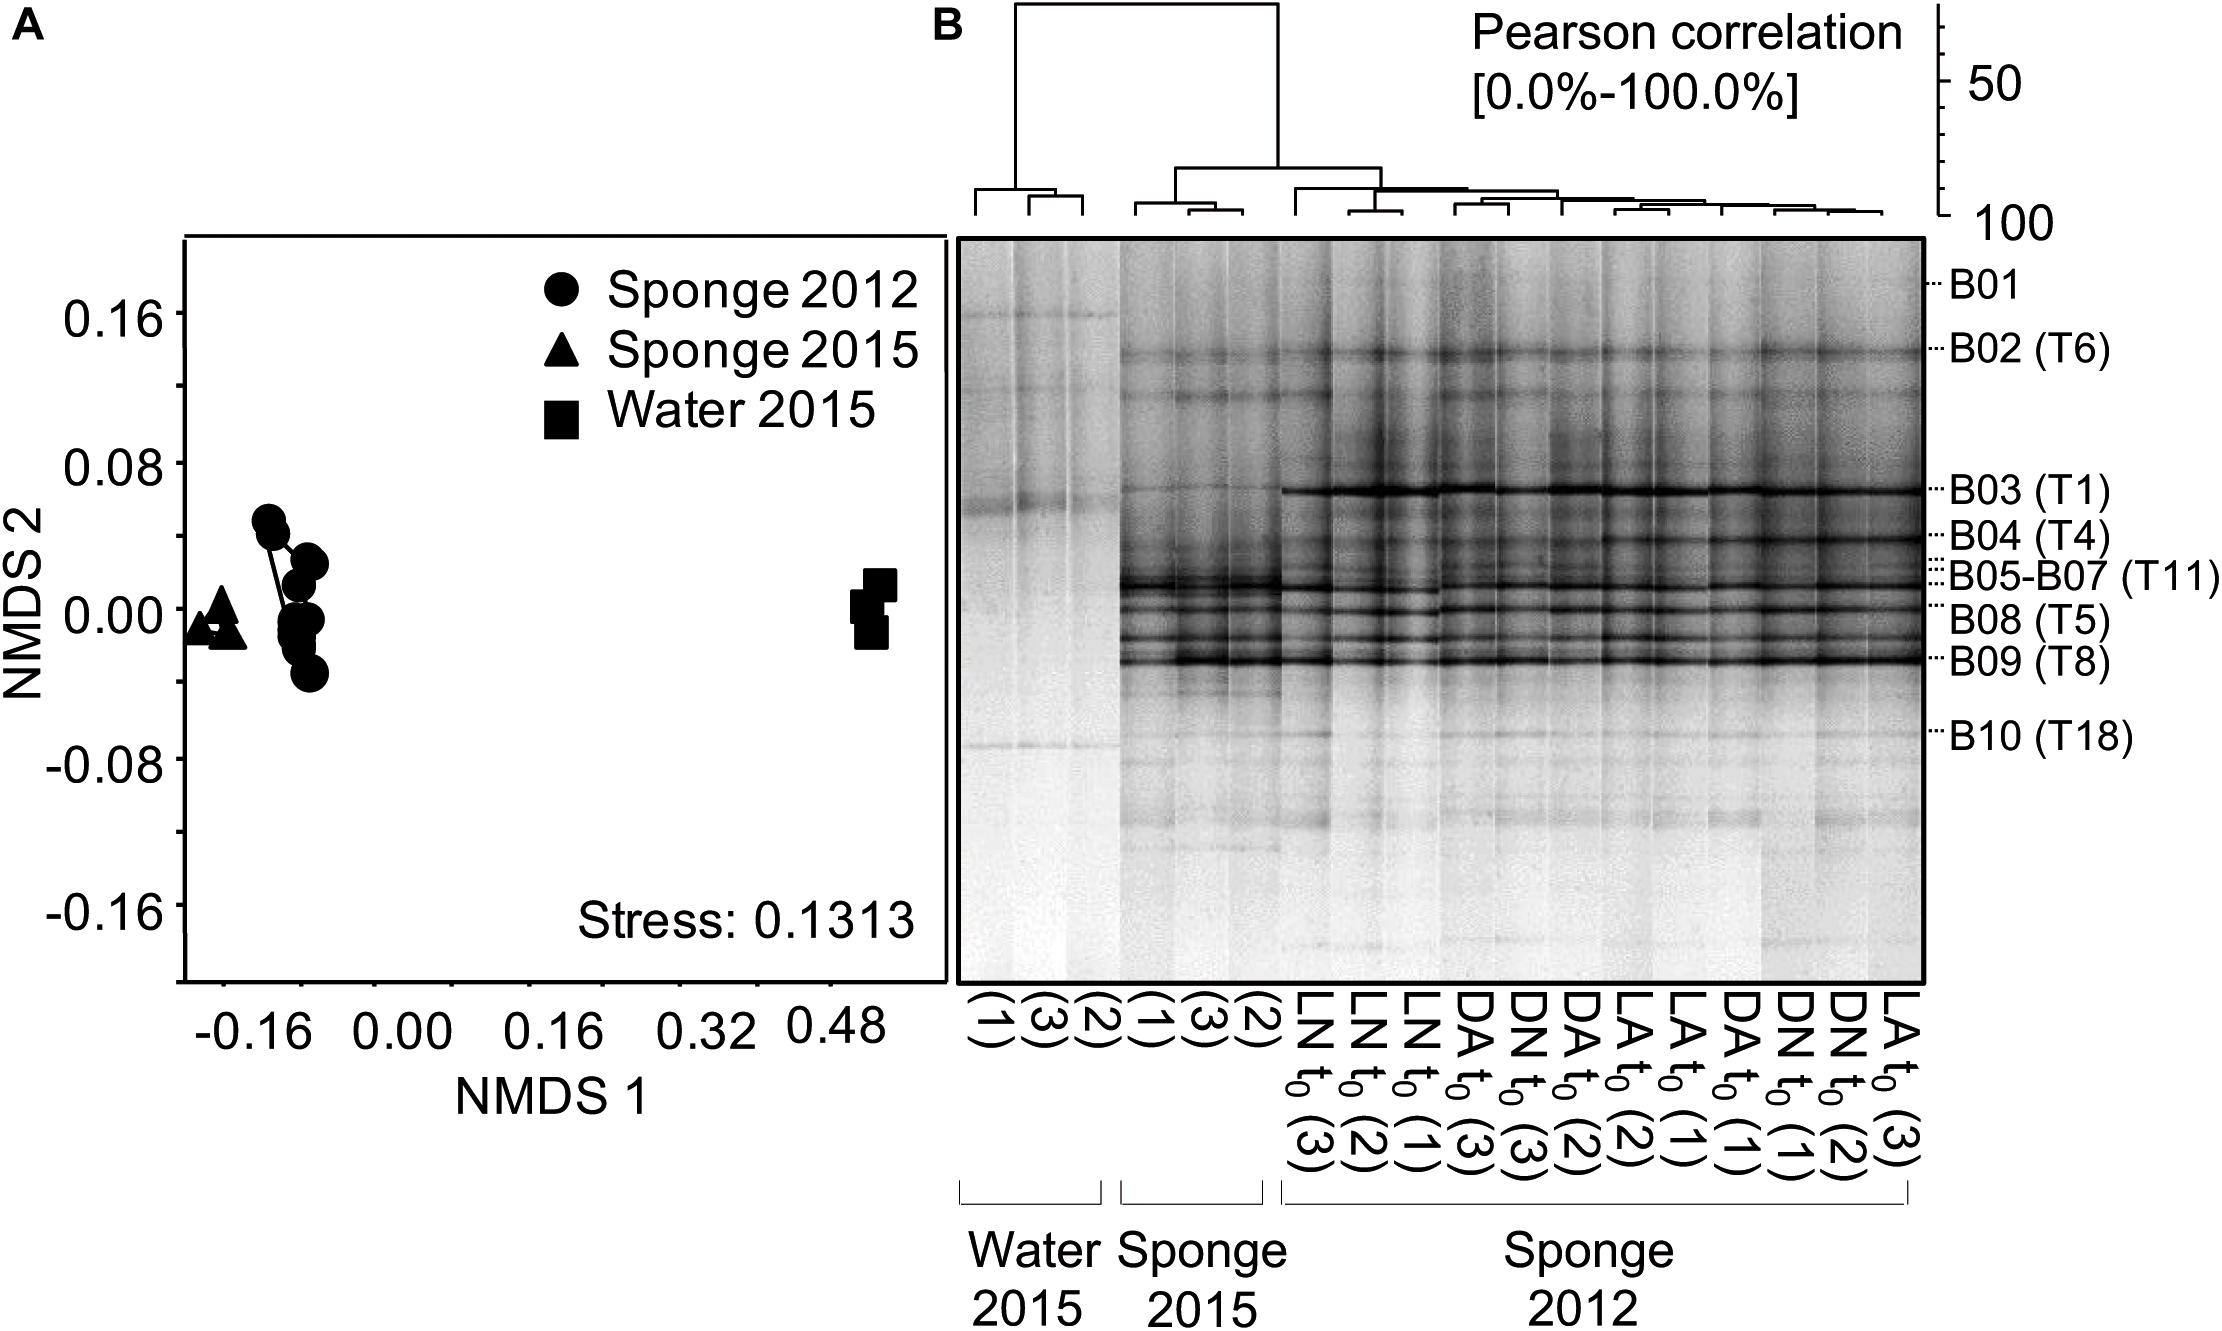
Figure 3. 16S rRNA gene sequence-based characterization of the specificity, stability, and diversity of the bacterial consortia associated with the studied Haliclona cnidata. Bacterial assemblages associated with the sponge and ambient water were investigated by PCR-DGGE community fingerprinting. (A) NMDS plot based on a Bray-Curtis dissimilarity matrix generated from relative abundance patterns of DNA bands in community fingerprint patterns. (B) Cluster analysis of DGGE community fingerprint patterns. Clustering was performed in GelCompar II with the UPGMA method based on a Pearson correlation matrix considering DNA band presence/absence and intensity. For each sample (Sponge 2012, Sponge 2015, Water 2015) denotation of biological replicate is given. DNA bands B01 to B10 in (B) refer to identified DNA bands representing most abundant taxa of the bacterial sponge microbiota (Table 1).
To assess the diversity and phylogenetic composition of the sponge (2012, 2105) and water (2015) associated bacterial communities on a higher taxonomic resolution, pooled replicates that showed identical DGGE patterns were subjected to 16S rRNA gene amplicon Illumina MiSeq sequencing. Total numbers of 89,577 (sponge 2012), 56,738 (sponge 2015), and 12,640 (water 2015) trimmed high quality paired-end 16S rRNA gene sequences identified as Bacteria were obtained (Supplementary Table S2). Analysis of the pooled DNA samples of biological replicates indicated that the richness of sponge-associated bacterial assemblages was much lower than that of the water-associated bacterial assemblages (lower richness and Chao1-bc index values) (Supplementary Figure S2A). A total of 134 (2015) and 275 (2012) phylogenetic groups were detected in sponge samples, while twice as much phylogenetic groups (n = 578) were detected in ambient water samples (Supplementary Table S4). Phylogenetic groups were less evenly distributed in the sponge than in water-associated bacterial assemblages (lower evenness index values in sponge samples; Supplementary Figure S2A) with few abundant phylogenetic groups in the sponge samples (higher dominance values), while many phylogenetic groups occurred with an equally low abundance in the water sample. This also confirmed the observation obtained by DGGE (see above). The higher diversity of the water-associated bacterial assemblages compared to the less diverse bacterial assemblages of the sponge samples was also illustrated by rarefaction curves (Supplementary Figure S2A), where the number of sequences was plotted against rarefied numbers of phylogenetic groups.
Sponge-associated bacteria were assigned to 27 phyla including several Candidatus phyla (Figure 4A and Supplementary Table S5). The sponge microbiome was dominated by Proteobacteria (relative abundance of 46–49%), followed by Acidobacteria (9–17%), Verrucomicrobia (10–11%), Gemmatiomonadetes (7–14%), Bacteroidetes (9%), Chloroflexi (4–5%), and Actinobacteria and Cyanobacteria (both 3%). Among Proteobacteria, Alphaproteobacteria (14–19%), Gammaproteobacteria (13–21%), the uncultured JTB23 group (2–14%), and Deltaproteobacteria (4–7%) were most abundant (Figure 4A). The high relative abundance of Acidobacteria, Verrucomicrobia, Gemmatiomonadetes, and Chloroflexi in sponge samples mainly contributed to the specificity of the sponge-associated bacterial microbiome, while Actinobacteria and Planctomycetes mainly accounted for the specificity of the water-associated bacterial community as indicated by principle component analysis (PCA) (Supplementary Figure S3).
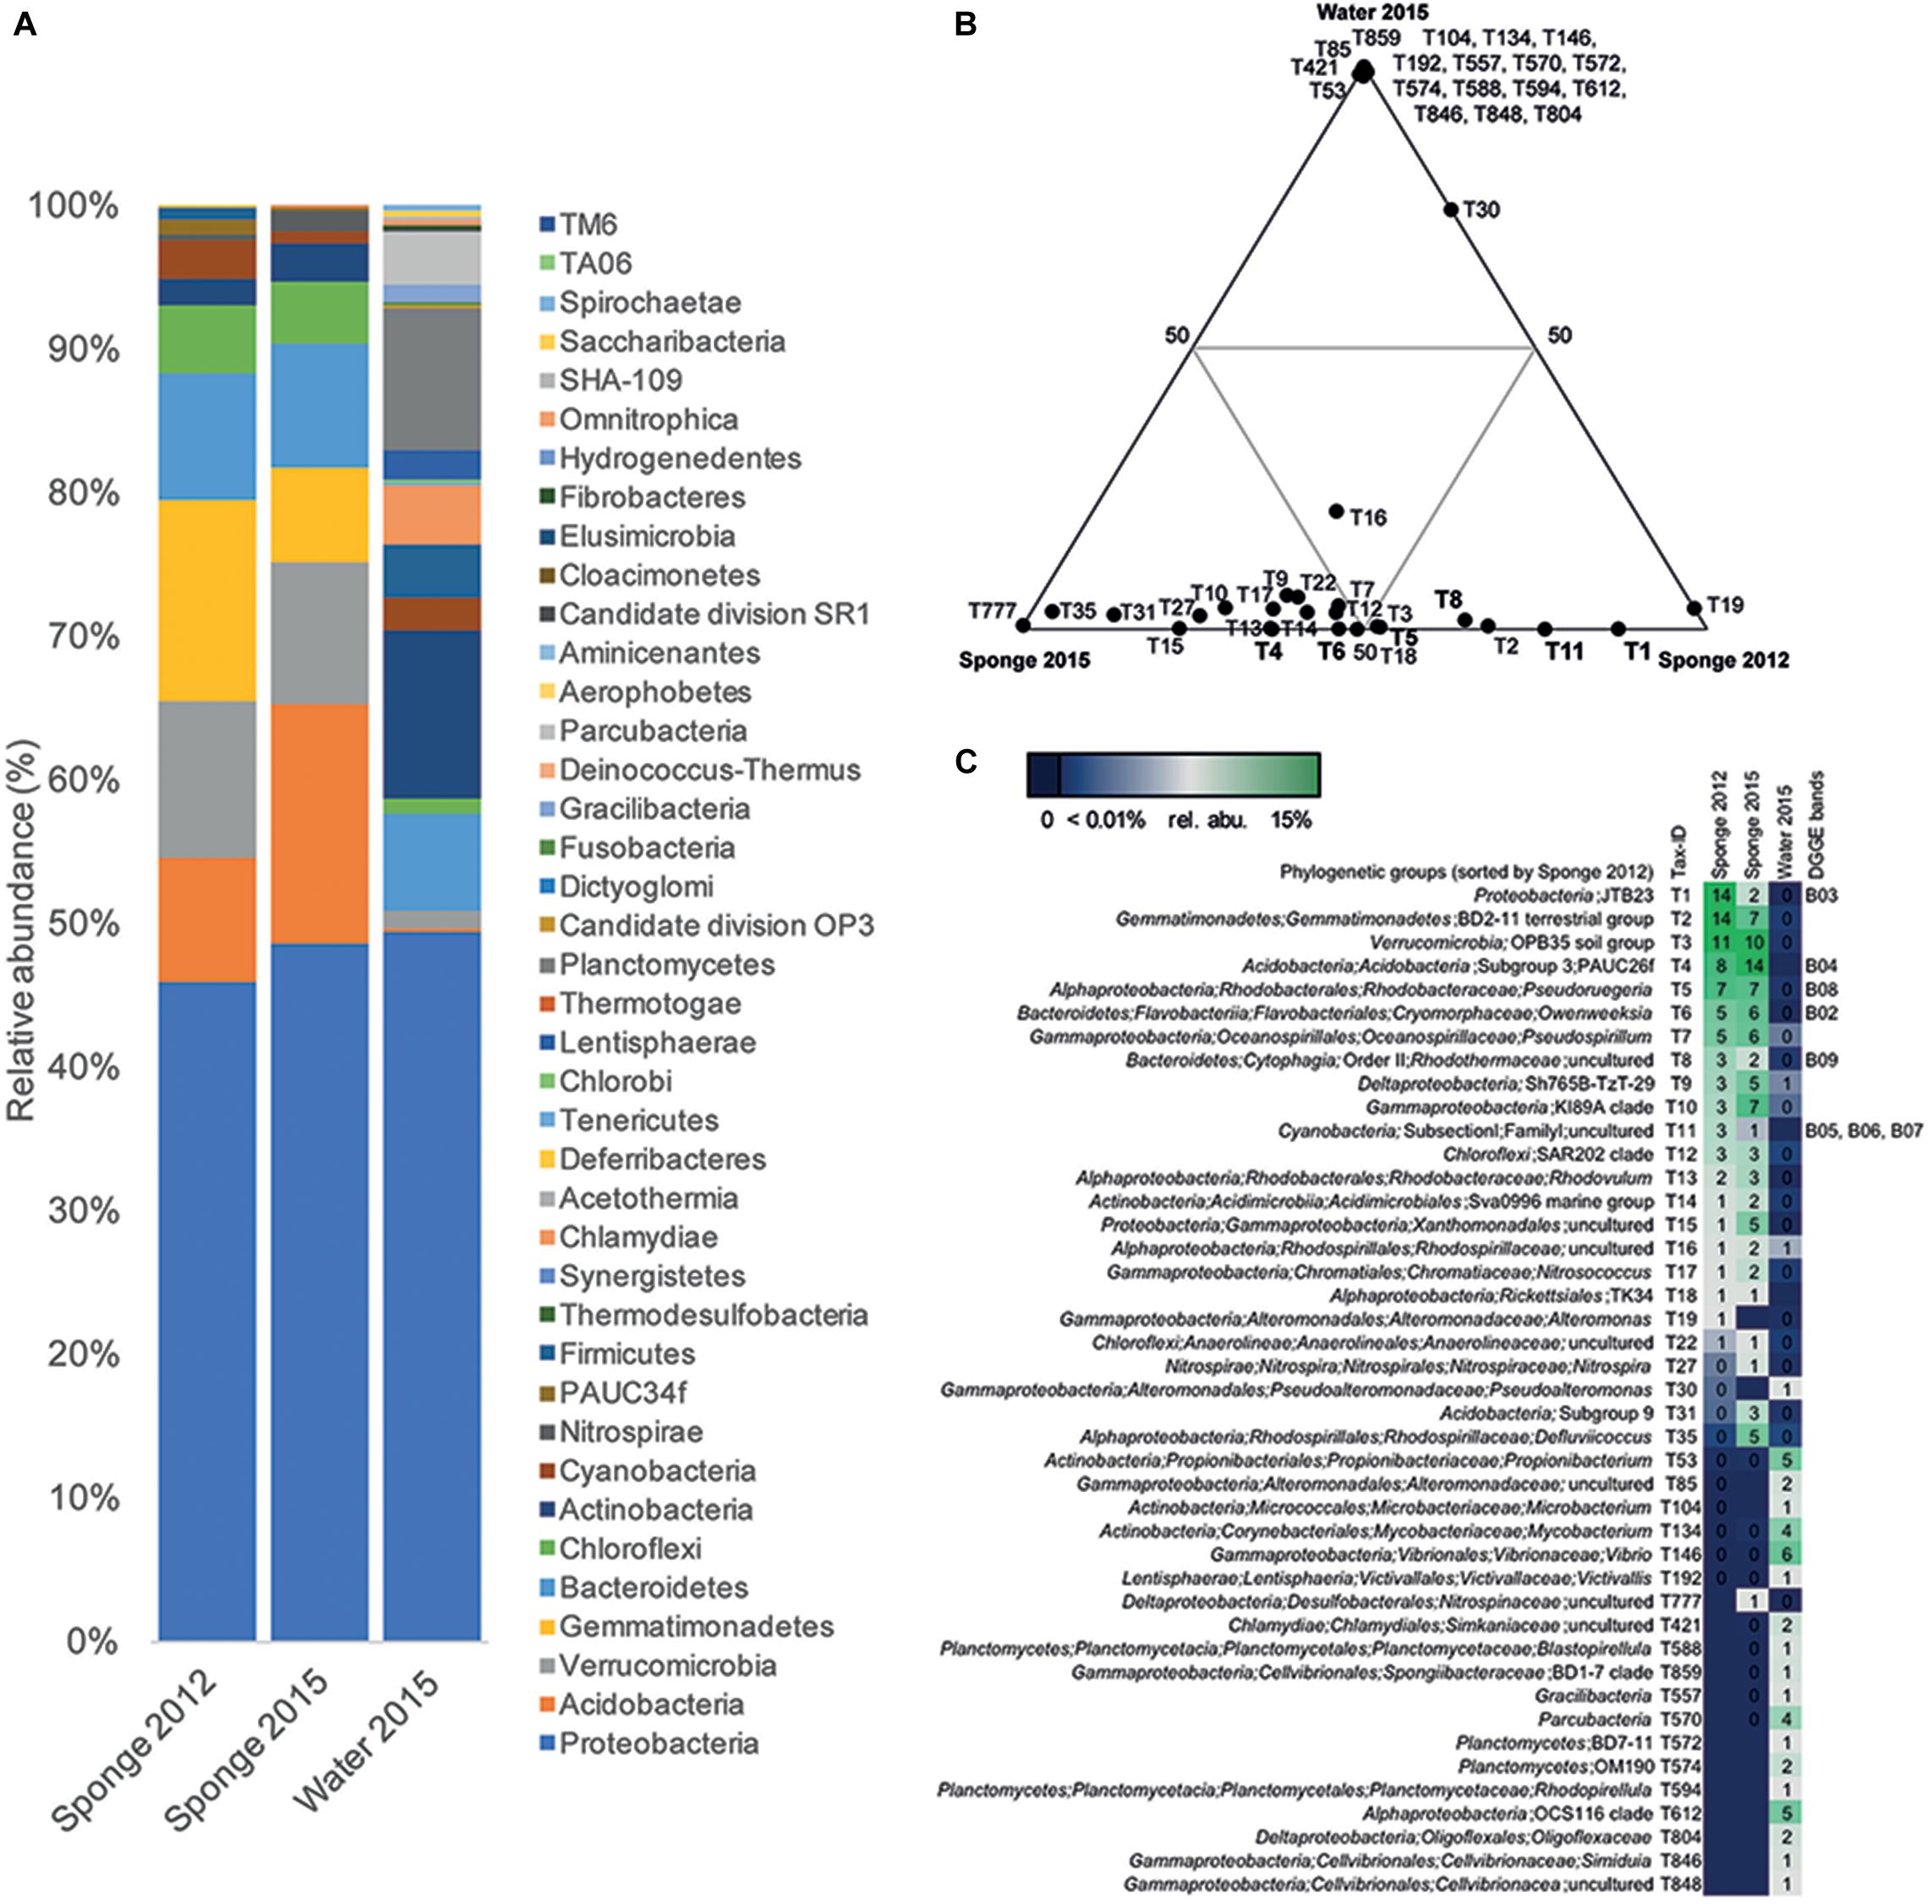
Figure 4. Phylogenetic composition of the bacterial Haliclona cnidata microbiome analysed based on 16S rRNA gene amplicon sequence data. Phylogenetic analysis of sponge and water-associated bacterial communities: (A) Relative abundance pattern of phyla present in sponge-fragment samples in 2012 and 2015 and water samples collected in 2015. (B) Ternary plots showing the distribution of phylogenetic groups among the sponge and water samples. Only taxa with a relative abundance ≥1% were considered. Each circle represents one taxon labeled with a taxon-specific tax-ID. (C) Phylogenetic assignment and relative abundance (presented as heat map) values of respective taxa in individual samples. Corresponding DNA bands (Figure 3B) are shown if applicable.
In total, 340 different phylogenetic groups were detected in the sponge, among those 23 phylogenetic groups that occurred with a relative abundance of at least 1% in one of the samples (Supplementary Table S6). Most of those phylogenetic groups (21 out of 23) occurred in the sponge collected in 2012 and 2015 and comprised phylogenetic groups that represented the abundant DNA bands in the DGGE profiles (Figure 4C). Ternary plots based on phylogenetic groups with a relative abundance of ≥ 1%, visualized the clear differences in the presence of the phylogenetic group in the sponge vs. water samples (Figures 4B,C). The most abundant (>10% relative abundance in at least one sponge sample) phylogenetic groups in the sponge-microbiome were uncultured bacteria of the JTB23 group (T1; Proteobacteria), the BD2-11 terrestrial group (T2; Gemmatimonadetes), the OPB35 soil group (T3; Verrucomicrobia), and PAUC26f (T4; DNA band B04; Acidobacteria) (Figure 4C). Additional phylogenetic groups with a moderate relative abundance (3–7%) in the sponge samples were all sponge-specific (i.e., undetected in water samples) and comprised the genera Pseudoruegeria (T5; DNA band B08; Alphaproteobacteria), Owenweeksia (T6; DNA band B02; Bacteroidetes), Pseudospirillum (T7; Gammaproteobacteria) as well as phylogenetic groups representing uncultured taxa, such as clades KI89A (T10; Gammaproteobacteria), Sh765B-TzT-29 (T9; Deltaproteobacteria), and SAR202 (T12; Chloroflexi).
Sponge Fragments With Compromised, Resilient Bacterial Consortia Sustained Bioactivity
To impair transient and non-resilient members of the bacterial microbiota, sponge fragments were exposed to antibiotics (ampicillin/gentamicin) and/or grew under light exclusion for a period of 29 days (Supplementary Figures S1A,B). Three treatments with three independent replicates each were performed, light and antibiotics, LA; dark and no antibiotics, DN; dark and antibiotics, DA) and compared to untreated controls (LN). The treatments led to a color change of the sponge compared to its native dark gray to purple color shown under control conditions (normal light conditions, LN) to weak brown and pale (Figure 5A). These changes were observed in all three replicate tanks. The tips of the erected fingers of the sponge started to bleach after four days (t4). After eight days (t8), sponges of the antibiotic light treatment (LA) were completely white and first signs of fouling occurred in all antibiotic treatments (LA, DA). After 17 days of treatment (t17), the color of sponges had changed to weak brown under light exclusion (DN and DA), while the tips appeared pale and the fouling had intensified for the white fragments in antibiotic light treatments (LA). After 29 days (t29), at the end of the experiment, sponges of the dark treatments had completely lost their color and the fouling in antibiotic light treatments had proceeded. For individuals of the antibiotic dark treatment (DA), no changes could be observed in comparison to t17. Sponges of the control aquaria (LN) showed no morphological changes during the experiment.
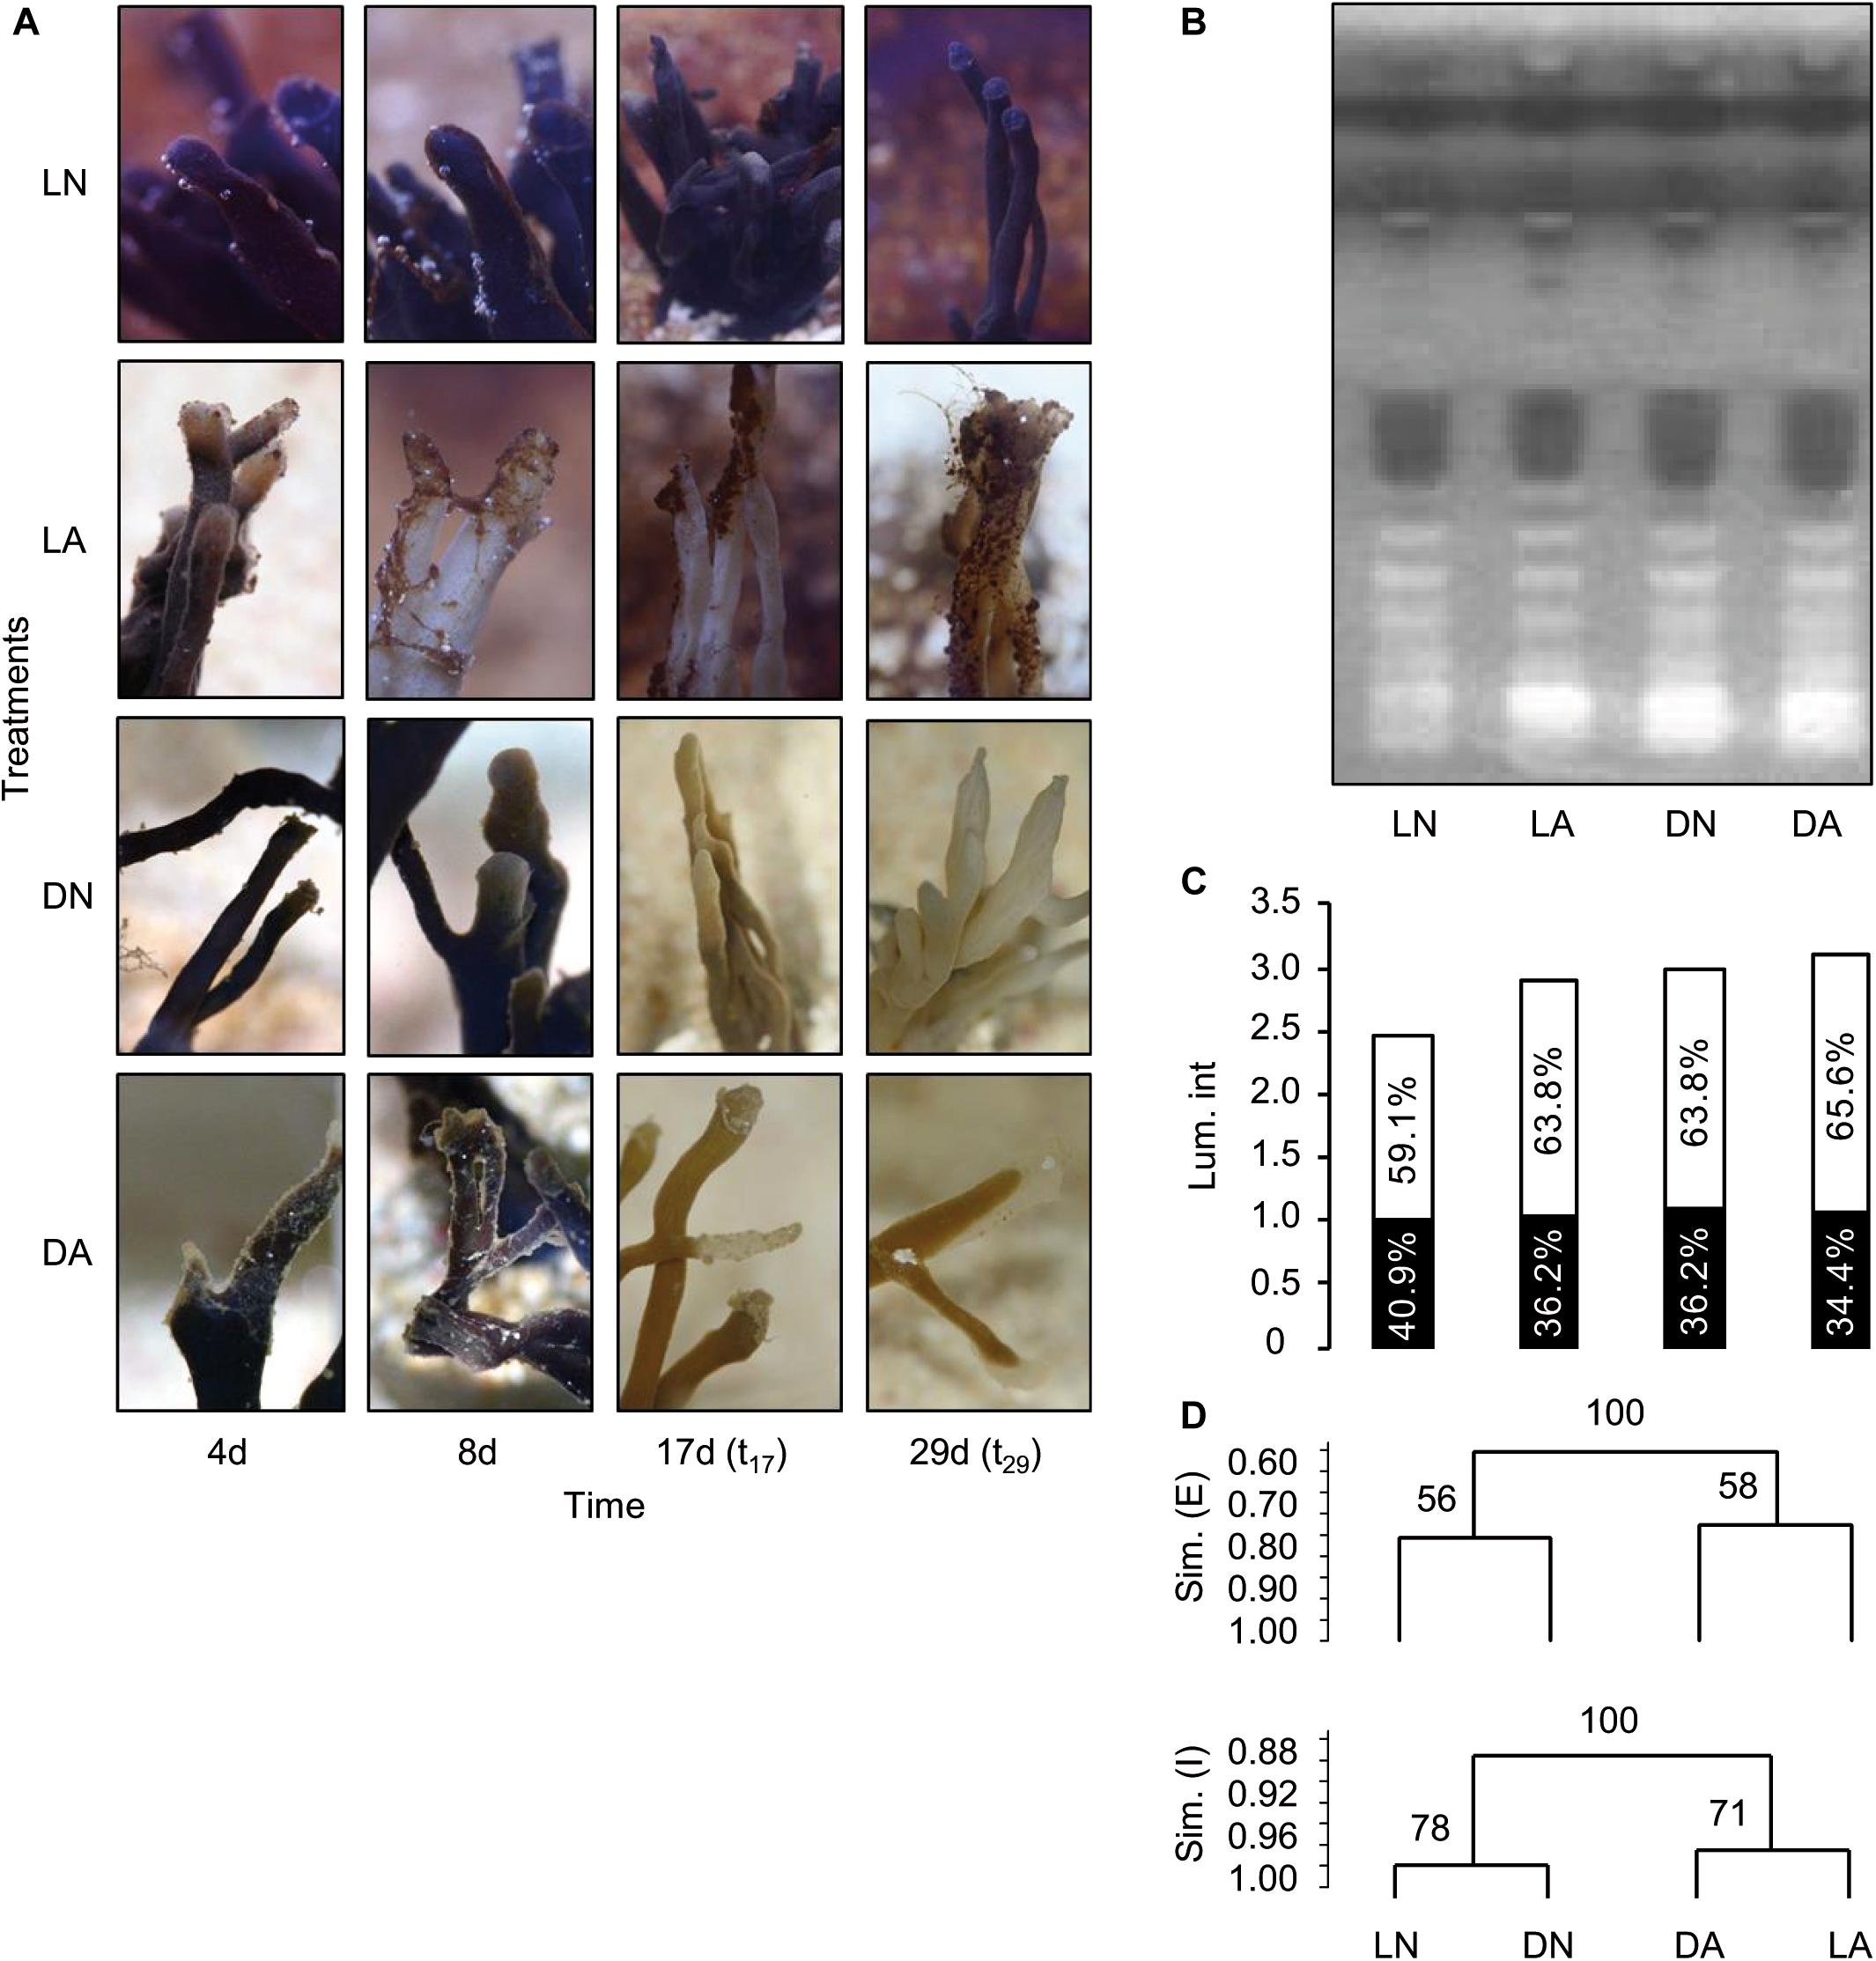
Figure 5. Morphological changes of Haliclona cnidata fragments and bioactivity screening after exposure to antibiotics and light depletion. Stressor specific morphological changes (A) were observed for sponge fragments over time being exposed to either antibiotics in light (LA), dark incubation without antibiotics (DN) or antibiotics plus dark incubation (DA) compared to normal light conditions (LN). (B) After 29 days (t29), methanolic extracts of the sponge were comparatively screened for bioactivity by HPTLC coupled with the A. fischeri bioluminescence assay. (C,D) Bioluminescence intensity was measured after 2 min. Bar chart showing relative contribution (%) of enhancement (similarity, Sim. [E], brightened zones, white bar) and inhibition (Sim. [I], darkened zones, black bar) to overall luminescence intensity (Lum. Int.) per sample. Relative intensity patterns of A. fischeri bioactive zones were subjected to Pearson correlation-based cluster analysis. Respective analysis was performed in GelCompar II.
The biological activity of the individual sponge fragments was assessed by the A. fischeri based bioactivity screening (Klöppel et al., 2008, 2013; Kirchhoff et al., 2014). Following sponge symbiont manipulating stress conditions, methanolic extracts of sponge fragments were analyzed at t29. Bioluminescence of A. fischeri was monitored after the extracted compounds were separated by HPTLC (Figure 5B). Here, A. fischeri was used as a proxy for a pathogenic, invading bacterium as the fish-pathogen had been previously applied to determine the ...


Comments
Post a Comment